Microsoft Power BI
Microsoft Power BI is a powerful business analytics tool that enables organizations to analyze data and share insights in real-time. With Power BI, we created dashboards and interactive reports that can be accessed from anywhere, on any device.

- Centralize Data: One of the key benefits of Power BI is that it enabled us to centralize data from different sources. This means that data from various departments and sources can be integrated into one place, allowing for easier analysis and reporting. By centralizing data, businesses can gain a more comprehensive view of their operations, identify trends and patterns, and make data-driven decisions.
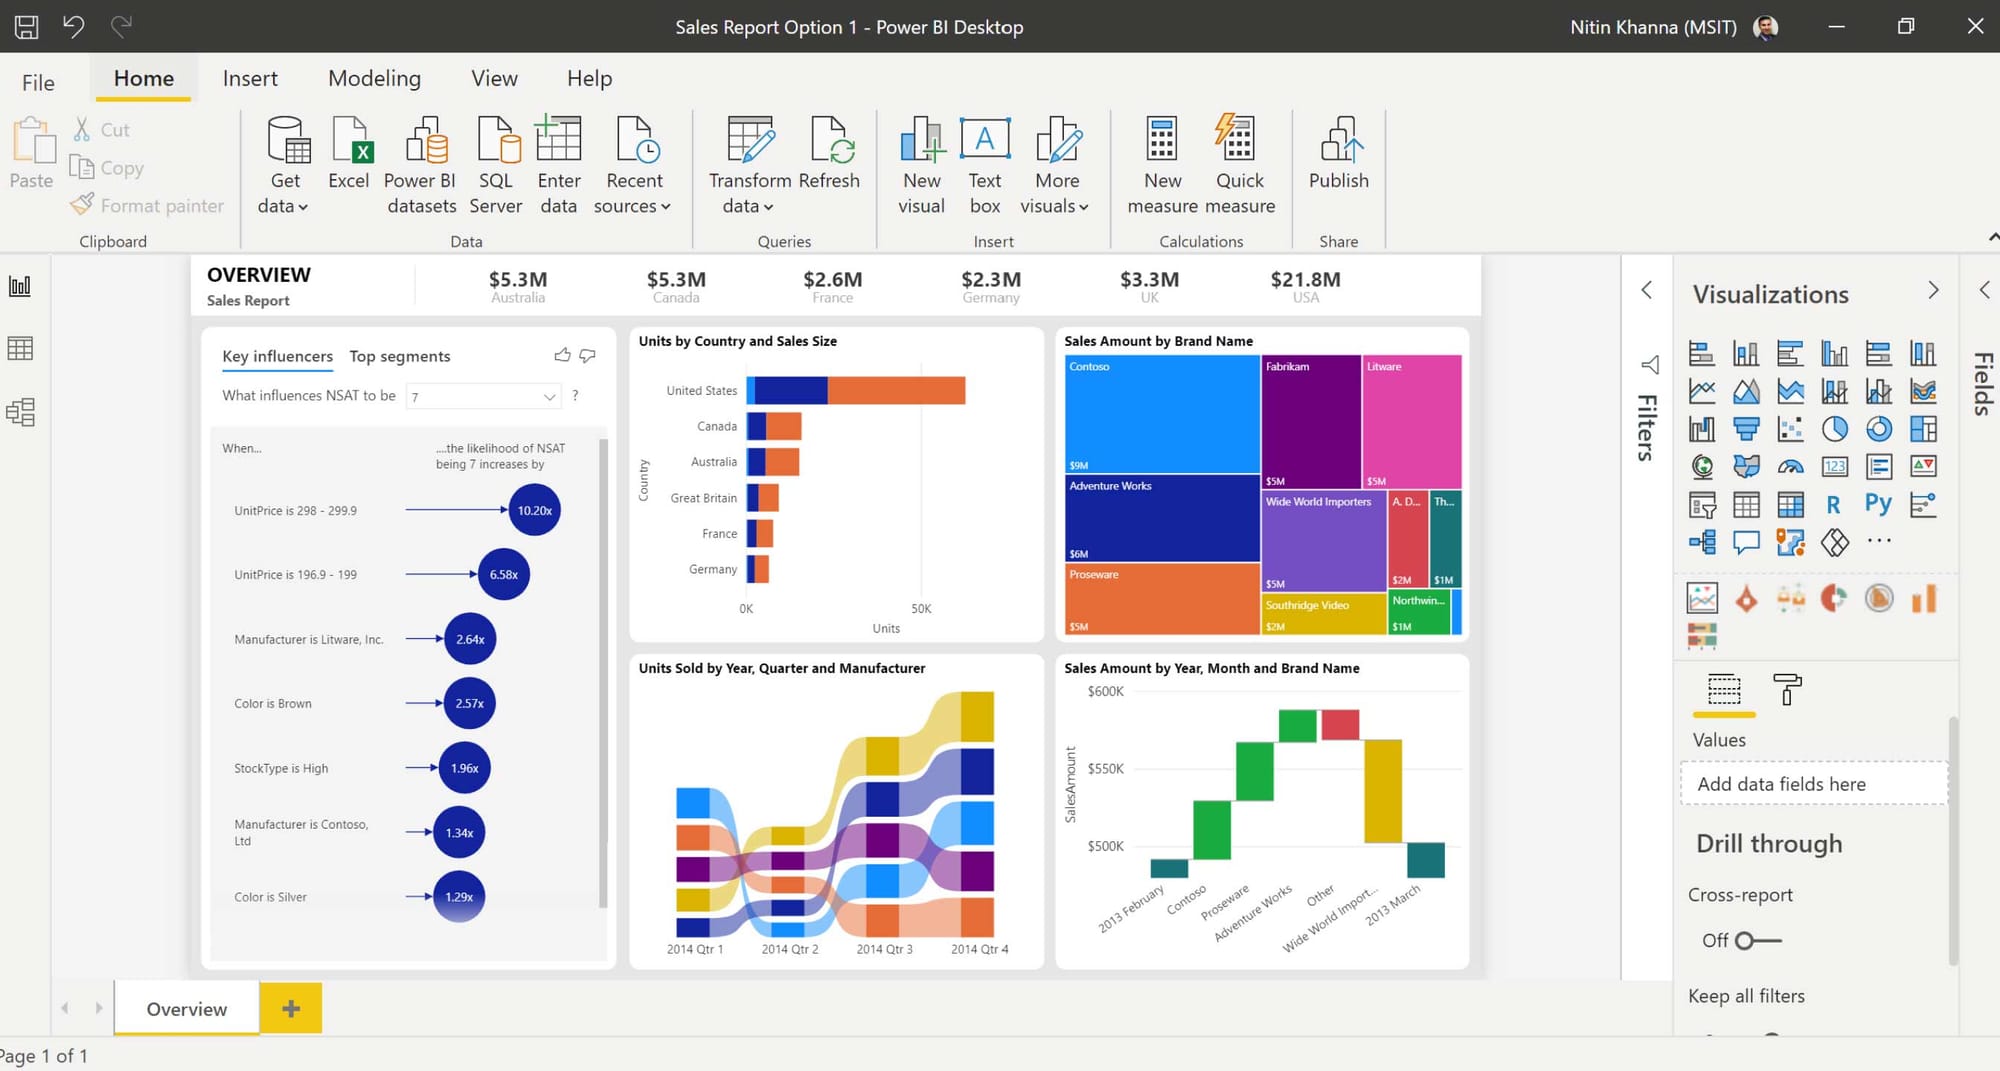
- Create Dashboards: Power BI enabled us to create customized dashboards that display real-time data. We designed dashboards to include key performance indicators (KPIs), charts, graphs, and tables, giving users a quick and easy way to monitor the health of the business. By creating dashboards, businesses can gain insights into their operations and make more informed decisions.
- Share Reports: Power BI makes it easy to share reports and dashboards with others. Reports can be shared internally within the organization or externally with clients and partners. With Power BI's sharing features, businesses can collaborate more effectively and ensure that everyone is working with the same data.
- Automated Reporting: Power BI enabled our business to create automated reports that are generated and sent out on a regular schedule. This means that key stakeholders can receive reports on a daily, weekly, or monthly basis without having to request them. By automating reporting, businesses can save time and resources while ensuring that everyone is kept up-to-date with the latest information.
PowerBI is a Trademark of Microsoft Corporation